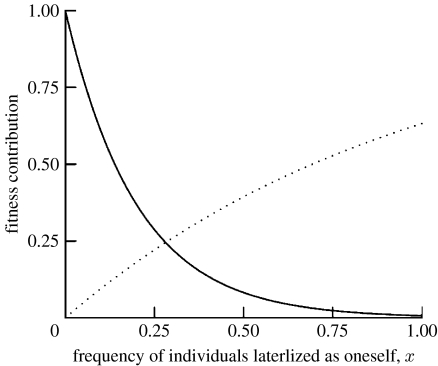
Figure 1.
Graph of the functions a(x) and s(x) (equations (2.2) and (2.3)), which enter fitness (equation (2.1)). Parameter values: ka=5, ks=1. Since ka>ks=1, the fitness contribution of antagonistic interactions a(x) decays more quickly than the fitness contribution of synergistic interactions s(x) increases. Solid curve, antagonistic interactions, a(x); dotted curve, synergistic interactions, s(x).

