Fig. 1.
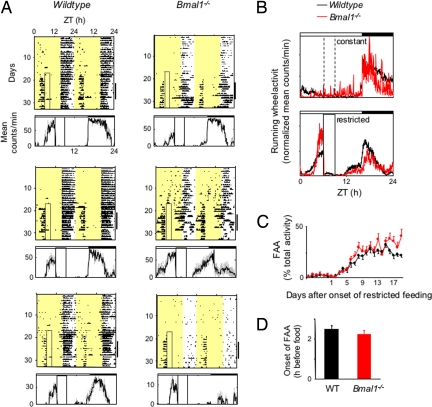
Normal FAA in Bmal1−/− mice. (A) Representative double-plotted actograms of daily running-wheel activity of 3 Bmal1−/− mice and 3 wild-type littermates (as indicated) during constant food availability and under subsequent temporal restricted feeding. The boxed area toward the left side of each actogram indicates the daily interval of food availability under temporal food restriction, and yellow areas indicate time of lights-on (16:8 light–dark cycle in these experiments). Under a light–dark cycle, Bmal1−/− mice show a diurnal variation in locomotor activity because of the acute suppressive effect of light on the behavior (masking). For clarity, the 4-day gradual narrowing of the interval of food availability is not included in the boxed area (Fig. S1). The graphs below each plot show the profile of daily running-wheel activity for each animal, averaged across 7 days during temporal food restriction (marked by the black bar on the right of each actogram). Gray vertical lines represent ± SEM. A similar FAA was observed with Bmal1−/− mice in a 12:12 light–dark cycle. ZT, Zeitgeber time. (B) Mean locomotor activity profiles of Bmal1−/− mice and wild-type littermates (n = 10 for each genotype) under constant food availability (Upper) and after subsequent temporal food restriction (Lower). Individual mean 7-day profiles have been normalized by total daily activity so that each animal contributes equally to the shape of the profile; each data point represents normalized counts per minute averaged across a 6-min bin (mean ± SEM). Time of light–dark cycle is indicated by white (light) and black (dark) bars at the top of each panel. Broken vertical lines (Upper) indicate, for comparison, the daily interval corresponding to subsequent restricted food availability; solid vertical lines (Lower) indicate the daily interval of food availability under temporal food restriction. (C) Time course of the development of FAA in Bmal1−/− mice (n = 22) and wild-type littermates (n = 20). Shown is the daily percentage of running-wheel activity (mean ± SEM) allocated to a 3-h time interval, ZT3–6. After 4 days of a gradually narrowing window of food availability, the final temporal food restriction started on day 1 (food available from ZT6–9). (D) Number of hours by which FAA anticipated daily food availability in Bmal1−/− mice and wild-type littermates (n = 20 for each genotype). For each animal, the running-wheel activity profile was averaged over 7 consecutive days during stable temporal food restriction (as in B), and the average time of onset of FAA was defined as the time before food presentation at which the FAA peak rose to its half-maximum (mean ± SEM). The difference between genotypes is not statistically significant.

