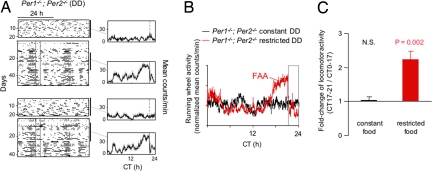
Fig. 5.
Normal FAA in Per1−/−; Per2−/− double-mutant mice in constant darkness. (A) Representative double-plotted actograms of daily running-wheel activity of 2 Per1−/−; Per2−/− mice during constant food availability and under temporal food restriction in constant darkness. Data are displayed as in Fig. 3B. Note arrhythmic, ultradian activity before temporal food restriction. (B) Mean locomotor activity profiles of Per1−/−; Per2−/− mice (n = 8) during constant food availability (black) and after subsequent temporal food restriction (red). Data are displayed as in Fig. 3C. (C) Quantification of FAA in Per1−/−; Per2−/− mice (n = 8) in constant darkness. Data are displayed as in Fig. 3D.

