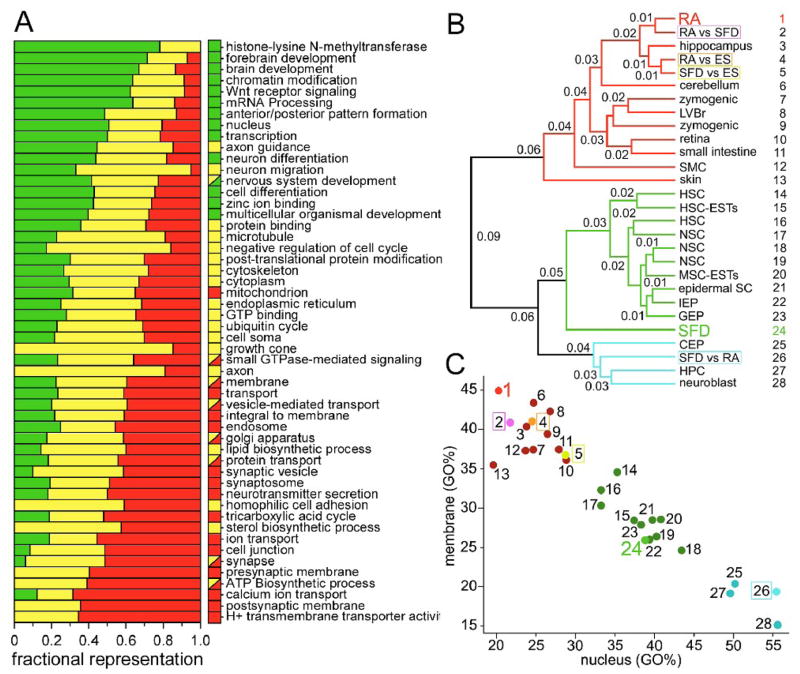
Figure 4. Profile Comparison.
(A) Fractional representation of gene sets grouped by Gene Ontology terms. Boxes next to each Gene Ontology term indicate significance for genes specifically enriched in cells induced with SFD medium alone (green), for genes enriched in cells induced with SFD medium plus exposure to RA (red), or genes that were enriched in both populations relative to undifferentiated mES cells (yellow). Note that seven of the Gene Ontology terms (small GTPase-mediated signalling, membrane, vesicle-mediated transport, golgi-apparatus, protein transport, synapse, and ATP biosynthetic process) displayed significant representation both in the RA (red) and in the SFD and RA (yellow) categories, albeit each gene was only assigned to one category (see Table S3–5 for quantitation). (B) Hierarchical clustering based on the relative frequency of Gene Ontology term representation in data sets derived from tissue-derived stem cells, transit amplifying cell types and various differentiated cell populations presented as a dendrogram. Fractional numbers indicate the degree of dissimilarity, calculated as 1-Pearson’s coefficient of similarity, between two profiles at the depicted branch point. Genes specifically enriched in cells induced with SFD plus RA exposure (RA, 1) cluster with profiles of mature tissues, including hippocampus (3) and cerebellum (6); whereas genes enriched in the SFD alone cell cultures relative to RA-treated cells (SFD vs RA, 26) clustered most closely with transit-amplifying cell populations (25, 27, 28). Genes specifically enriched in SFD medium alone (SFD, 24) are intermediate to the transit amplifying and tissue-derived stem cell populations. By contrast, genes enriched in RA-treated cells relative to cells differentiated without RA (RA vs SFD, 2) clustered together with the genes specific for RA-treated cells (RA, 1) and with genes enriched in SFD alone (SFD vs ES, 5), or in RA-treated cells (RA vs ES, 4), relative to the undifferentiated ES cells. (C) Segregation of fully differentiated tissues, tissue-specific stem cell populations, and transit amplifying cell types based on fractional representation of membrane and nucleus GO terms.

