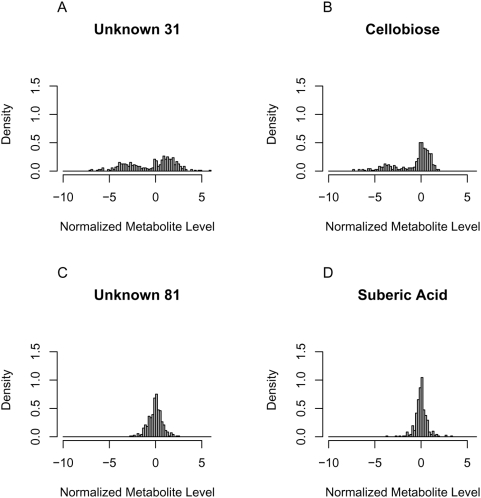
Figure 4. Histograms of particular metabolic markers over all 359 investigated RILs.
Here, unit area histograms are presented, i.e. the particular curve shows proportions rather than absolute numbers. Thus it constitutes a simple density estimate. The x-axis demonstrates normalized metabolite levels and is divided into equidistant intervals. The y-axis represents the relative frequency per interval. The panels A and B show the two metabolic markers with the highest VIP in each investigated model, i.e. Unknown 31 (using a functional group prediction service offered by the Golm Metabolome Database [41] at least one hydroxyl group was predicted to be present in Unknown 31) and Cellobiose. The levels of these highly predictive metabolic markers deviate obviously from normal distributions, namely they display bimodal distributions. The deviation from a normal distribution seems to abate with decreasing importance of the particular metabolic marker in the models. This is demonstrated by the two examples C and D of metabolic markers, which have in average the lowest VIP in our models.

