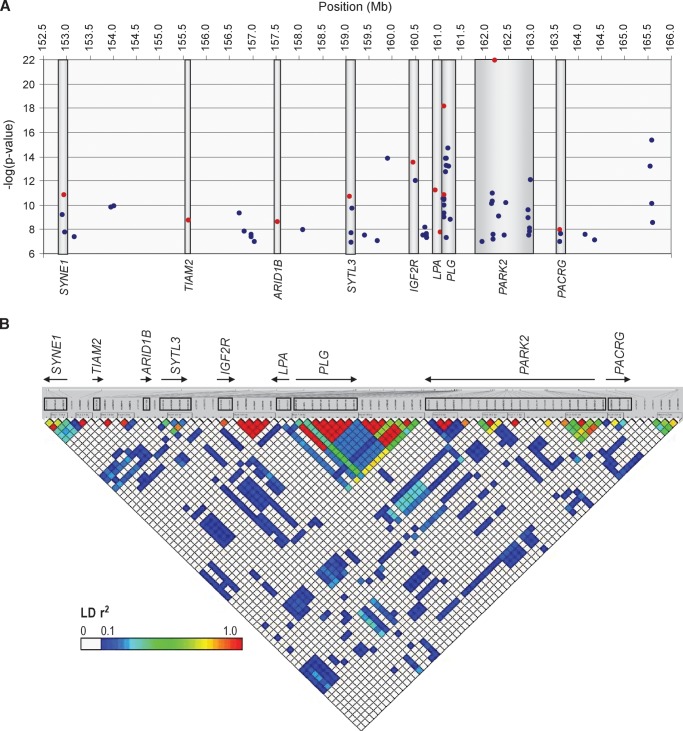
Fig. 2.
Seventy-seven SNPs on chromosome 6q that remained significant after adjusting for multiple comparisons using permutation-based empirical distributions, corresponding to association P values ≤1.14 × 10⁻⁷. The SNPs span from 152,912,509 to 165,610,428 Mb. A: SNPs reside within nine genes, shown on the bottom of the figure, and within 100 kb of an additional six genes (genes not shown). The locus (uncorrected) − log (P value) is on the y axis; SNPs selected for conditional (covariate) analyses are shown in red. B: LD (r2) between 77 associated SNPs, generated using LDselect, in 60 relatively unrelated (not first-degree relatives) Hutterites (30 males and 30 females). SNPs are equally spaced across the plot (not to physical scale). The names and direction of transcription are shown for each of the nine genes in A; SNPs within the nine genes are boxed. The comparison to LD in HapMap CEU is shown in supplementary Figure I.

