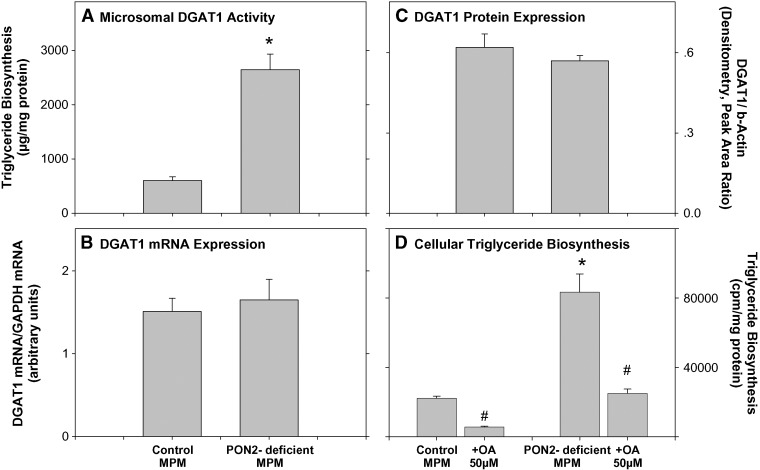
Fig. 3.
DGAT1 expression in peritoneal macrophages from PON2-deficient versus control C57BL/6 mice. MPMs were harvested from 5-month-old control (C57BL/6) mice and from age-matched PON2-deficient mice. A: The microsomal fraction was separated from the MPM of both mice groups. DGAT1 activity was determined in microsomes (30 μg protein/ml) as described in Materials and Methods. B: DGAT1 mRNA levels were determined by real-time PCR using GAPDH as the normalizing gene, as described in Materials and Methods. C: DGAT1 protein levels were determined by Western blot analysis using goat polyclonal antibody to DGAT1. β-Actin was used as the normalizing protein. Densitometric analysis of the bands is shown. D: MPMs from control mice or from PON2-deficient mice were incubated for 20 h at 37°C with DMSO or with 50 μM of the DGAT1 inhibitor oleanolic acid (OA; in DMSO). Then, the cells were washed and further incubated for 3 h at 37°C with 6 μCi/ml of [3H]oleate bound to fatty-acid-free BSA (2%) in the absence or presence of 50 μM oleanolic acid. After cell wash, the cellular lipids were extracted and separated by TLC. The radioactivity in the triglyceride spots was determined by liquid scintillation counting. Results are given as mean ± SD of three different experiments. *P < 0.01 versus control MPM. #P < 0.01 oleanolic-treated PON2-deficient MPM versus PON2-deficient MPM.

