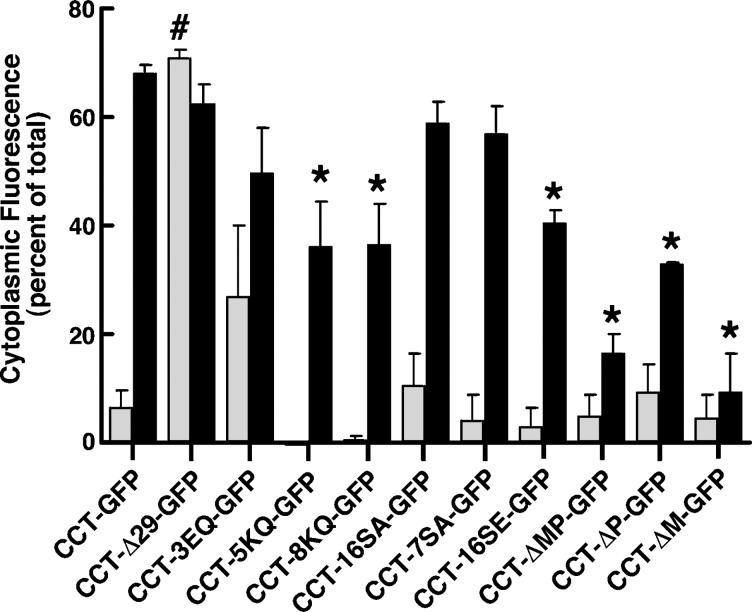
Fig. 5.
Quantification of nuclear export reveals a role for domain M. Vectors encoding wild-type and mutant CCT-GFP were transfected in CHO58 cells for 14 h and imaged following FOH treatment as described in the legend to Fig. 4. The percent distribution of GFP fluorescence in the cytoplasm of at least 20 control (grey bars) and FOH-treated (black bars) cells was quantified for each GFP fusion protein as described in Materials and Methods. *P < 0.05 compared with FOH treated CCT-GFP; #P < 0.05 compared with untreated CCT-GFP cells. Results are the mean and SEM of three separate experiments.

