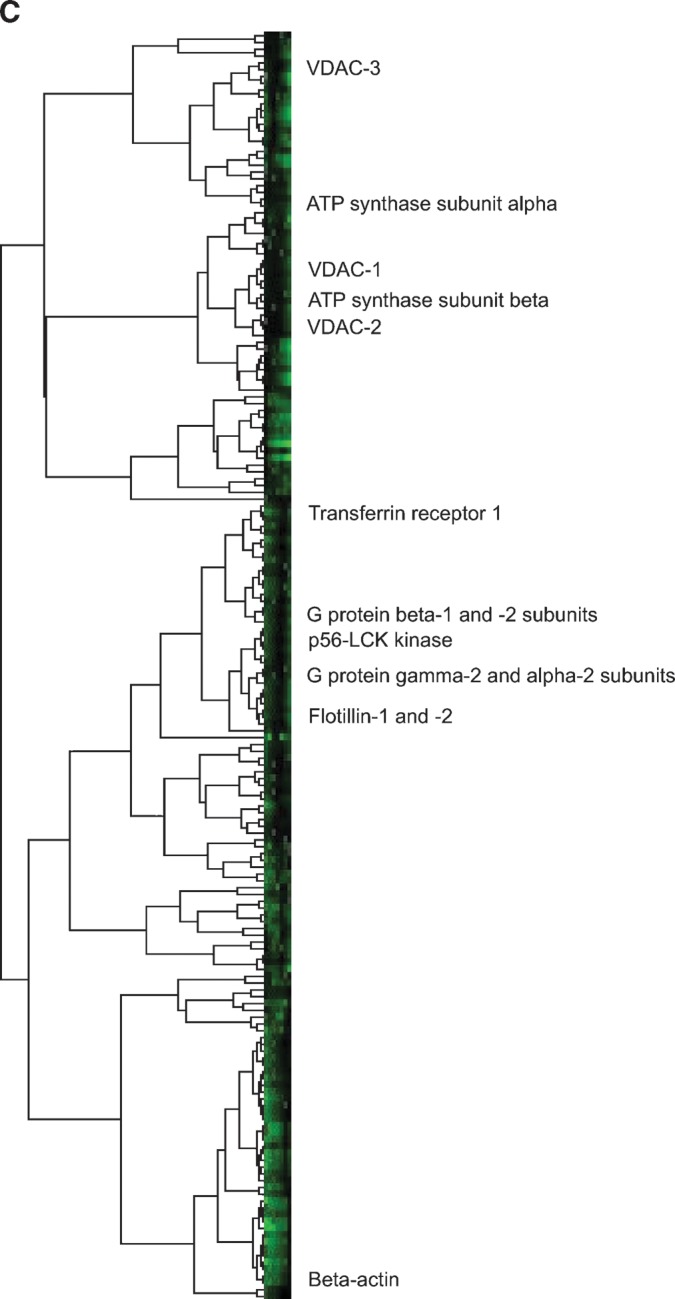
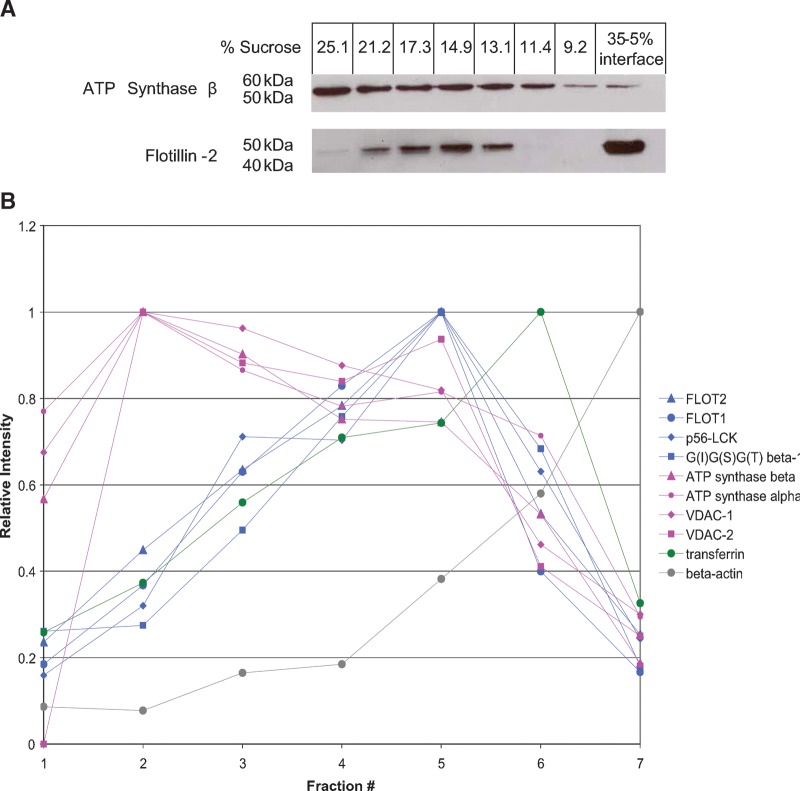
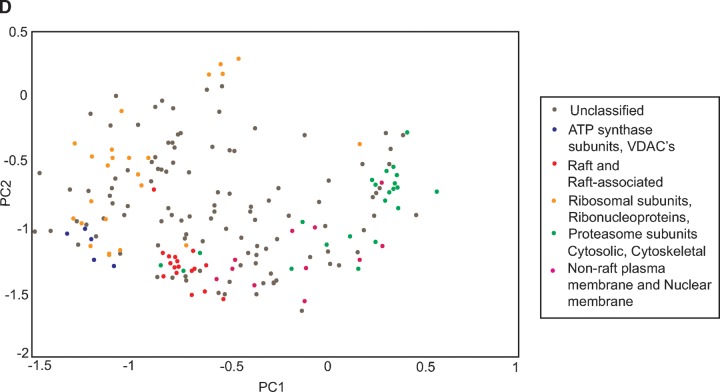
Fig. 5.

The separation of rafts and mitochondrial proteins in a linear sucrose gradient. A: Western blot of the lipid raft marker flotillin-2 and the mitochondrial ATP synthase β subunit in fractions taken from a linear sucrose gradient and a nonlinear gradient showing different distribution patterns. B: Some examples of protein profiles or protein distributions across the linear density gradient by PCP-SILAC. C: Hierarchical clustering on the PCP-SILAC data showing the separation of rafts and mitochondrial proteins into two distinct groups. D: PCA analysis on the PCP-SILAC data.


