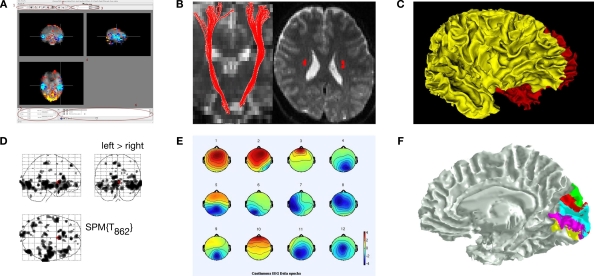
Figure 1.
Some common display conventions for neuroimaging data. Examples of some of the methods commonly used to display neuroimaging data. (A) FSL's FSLView is used in this example to show the overlay of fMRI data onto three orthogonal planes generated for a 3D MRI volume. (B) DTIStudio can display DTI-fiber paths as streamlines mapped onto orthogonal planes generated from 3D MRI Volumes. (C) FreeSurfer can be used to display surfaces extracted from MRI data. In this example the grey matter to white matter boundary is displayed in 3D, with separate surfaces for the left (red) and right (yellow) hemispheres of the brain. (D) SPM can be used to output 2D projections of regions of statistical significance to a ‘glass brain’ view. (E) EEGLab can be used to show iso-contour patterns of changing electrical fields over the scalp in 2D. (F) mrVista can be used to map scalar values (here different visual areas are represented by different colors) to a cortical surface.

