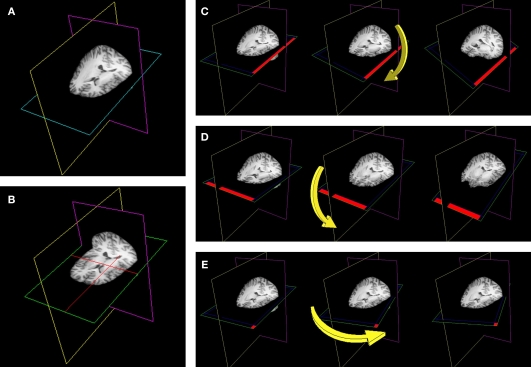
Figure 5.
The use of plane widgets to show 3D volume data. (A) A set of three orthogonal planes, each intersecting a single 3D MRI volume. (B) Left clicking on any one plane with a mouse will make a cross-hair visible (in red) allowing data from a specific coordinate in the data set to be displayed. Real-time reformatting of data (re-slicing it in any plane direction) is possible by tilting the planes around their current origin. (C) The axial plane is rotated around the y-axis by clicking on the edge of the plane (show in red) and moving the mouse. (D) The axial plane is rotated around the x-axis by clicking on another plane edge (shown in red). (E) The axial plane is rotated around the z-axis by clicking in the corner of the plane (shown in red).

