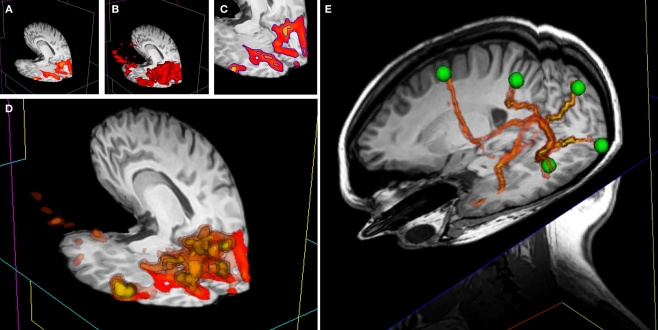
Figure 8.
3D overlay data using isosurface transparency. (A) 2D overlay data from an fMRI experiment overlaid onto a structural MRI volume. (B) The vtkContourFilter can be applied to create an isosurface through the data at a specific threshold value, say z = 2.3. The returned 3D surfaces will encompass all areas in the data set that have a z-score of z = 2.3 or above. We could repeat the process, asking the vtkContourFilter to return smaller surfaces as we increase the threshold. (C) A 2D representation (using isocontours shown in blue) of 2 separate isovalues used to extract surfaces. (D) If we simultaneously render five sets of surfaces, at z-scores of z = 2.3, 3.3, 4.3, 5.3, and 6.3, for example, the only set of surfaces visible would be that at z = 2.3, since all other surfaces are inside this surface. We can manipulate the transparency and color of the vtkPolyData class to make the distribution of activation visible and overcome this problem. By making the outermost surface (at the lowest threshold value) 80% transparent, the second outermost 60% transparent, the third 40% transparent, the fourth 20% transparent, and the highest threshold surface completely opaque, we make all surfaces simultaneously visible. To emphasize this effect, we can also apply a color gradient (yellow to red) across the surface threshold range. Interacting with this mode of visualization in 3D gives an instantaneous percept of the entire distribution of the activation in 3D. (E) This image shows a number of tracts output from FSL's Probtrack toolbox rendered using the 3D overlay technique. The tracts are seen as yellow to red isosurfaces. The green spheres indicate the positions of seed and target points as defined in Probtrack.

