Fig. 3.

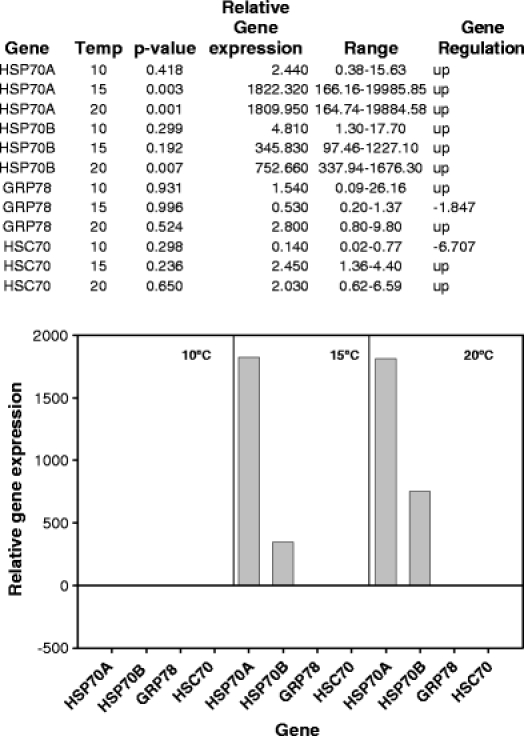
Q-PCR results for Nacella concinna over three different temperature heat shocks. Relative expression ratios of the HSP genes from the control compared to the experimental animals are shown both in table format and graphically

Q-PCR results for Nacella concinna over three different temperature heat shocks. Relative expression ratios of the HSP genes from the control compared to the experimental animals are shown both in table format and graphically