
Fig. 3.
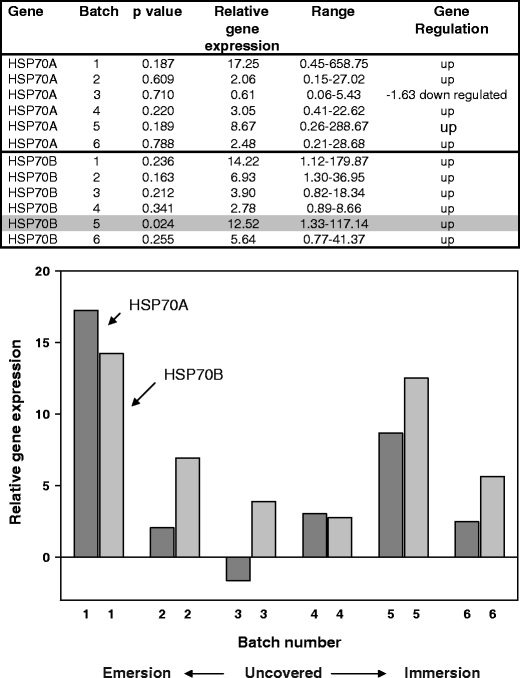
Q-PCR results for N. concinna HSP70A and HSP70B genes from animals collected on a late day in the austral summer. Relative expression ratios of the HSP genes from control compared to experimental animals are shown both in table format and graphically. Significant individual p values (5% and 10% level) with the different batches are shaded. Two-sample t test of HSP70A expression levels in environmental samples compared to controls gave a p value of 0.011. Two-sample t test of HSP70B expression levels in environmental samples compared to controls gave a p value of 0.000