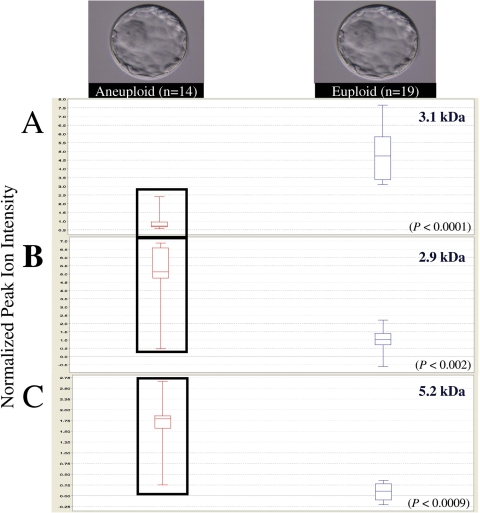
Figure 2.
Examples of biomarkers that were differentially expressed in the secretome signatures of euploid blastocysts (n = 19) compared with the secretome signature of aneuploid blastocysts (n = 14) (P < 0.05).
(A) Box plot revealing significant decrease in the expression of a 3.1 kDa biomarker in the secretome of aneuploid blastocysts compared with the secretome of euploid blastocysts (P < 0.0001) (B and C) Two box plots exhibiting significant increase in expression of 2.9 and 5.2 kDa biomarkers in the secretome of aneuploid blastocysts compared with the secretome of euploid blastocysts (P < 0.002 and P < 0.0009, respectively). The upper hinge of the box plot indicates the 75th percentile set, and the lower hinge the 25th percentile of the data. The internal line represents the median.

