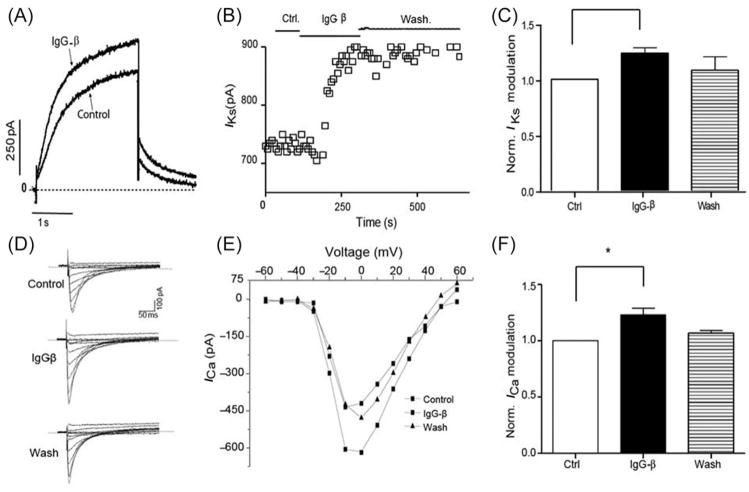
Figure 5.
IgG-β increases IKs and ICa current. (A) Representative trace of IKs before and during IgG-β perfusion. (B) Time course of the effect with bars indicating different conditions. (D) Typical trace of ICa under: control, IgG-β perfusion, and washout condition. In (E), I–V relationship from the same patient is plotted. (C) and (F) Normalized IKs and ICa values (values were normalized by the control condition—pre-IgG-β-perfusion-data in each cell) under control, IgG-β, and washout conditions (control vs. IgG-β *P < 0.05). Values are mean ± SEM; n = 4; *P < 0.05.

