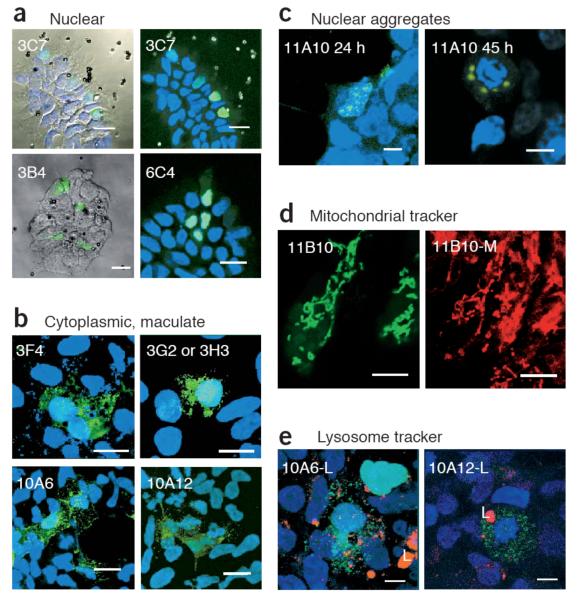
Figure 2.
Confocal microscopy images of selected clones from the colony-PCR bead-transfection screen of the EGFP peptide libraries. (a) Nuclear localized clones 3C7, 3B4 and 6C4 from the EGFP-KESL library, viewed by reflection, with the green EGFP signal and/or DAPI superimposed (left), or viewed by fluorescence microscopy with blue DAPI staining for nuclei (right). (b) Cytoplasmically distributed clones with maculate morphology. 3F4, 3G2 and 3H3 are from the KESL library, whereas 10A6 and 10A12 are from the Zif library. Note that 3F4 contains an SKL peroxisomal targeting signal. (c) The 11A10 clone, from the Lrm library, forms aggregates that are generally located next to the nuclear membrane (24 h) and increase size with time. When the cell is in mitosis, aggregates remain around the DNA (45 h). (d) The Lrm 11B10 clone, viewed with a green filter for EGFP (left) or viewed with red filters for MitoTracker dye (right; 11B10-M), reveals colocalization of the EGFP signal with mitochondria. (e) LysoTracker staining for lysosomes (L; red) shows that the green maculate distribution of the zinc fingers 10A6 and 10A12 is not lysosomal. Green, red and DAPI signals are superimposed. Scale bars: 20 μm (a,b); 8 μm (c,d,e).

