Figure.
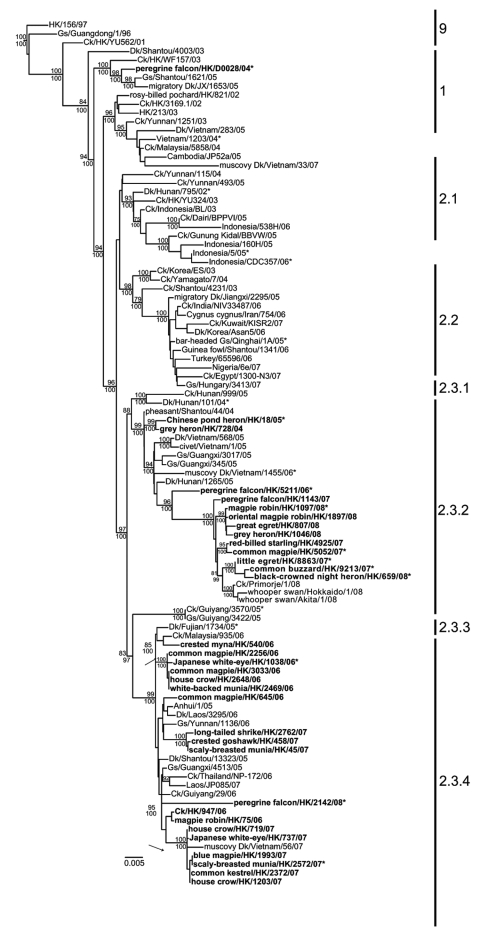
Phylogenetic relationships of the hemagglutinin genes of representative influenza viruses. Numbers above and below the branch nodes indicate neighbor-joining bootstrap values >70% and Bayesian posterior probabilities >95%, respectively. Not all supports are shown due to space constraints. Analyses were based on nt 49–1,677 and the tree rooted to duck/Hokkaido/51/1996. Numbers to the right of the figure refer to World Health Organization influenza (H5N1) clade designations (Appendix Table). Viruses isolated from wild birds and chickens in Hong Kong from 2004–2008 are in boldface. *Indicates viruses included in the antigenic analysis (Table). Scale bar indicates 0.01 nucleotide substitutions per site. Ck, chicken; Dk, duck; Gs, goose; HK, Hong Kong.

