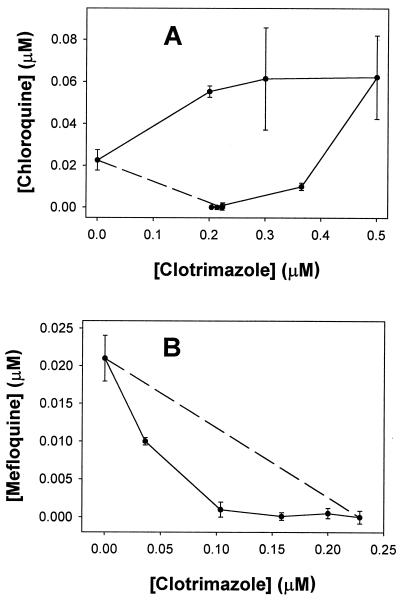
Figure 5.
Effects of combinations of CLT with chloroquine or mefloquine on P. falciparum growth in vitro (HB3 strain). Isobolograms show the effect of combinations of both CLT with chloroquine (A) and CLT with mefloquine (B). Values on both axis are IC50. The dashed line represents a simple additive effect. Error bars represent the SE of three replicates. Where error bars are not seen, they are smaller than the symbol size.

