
Figure 3.
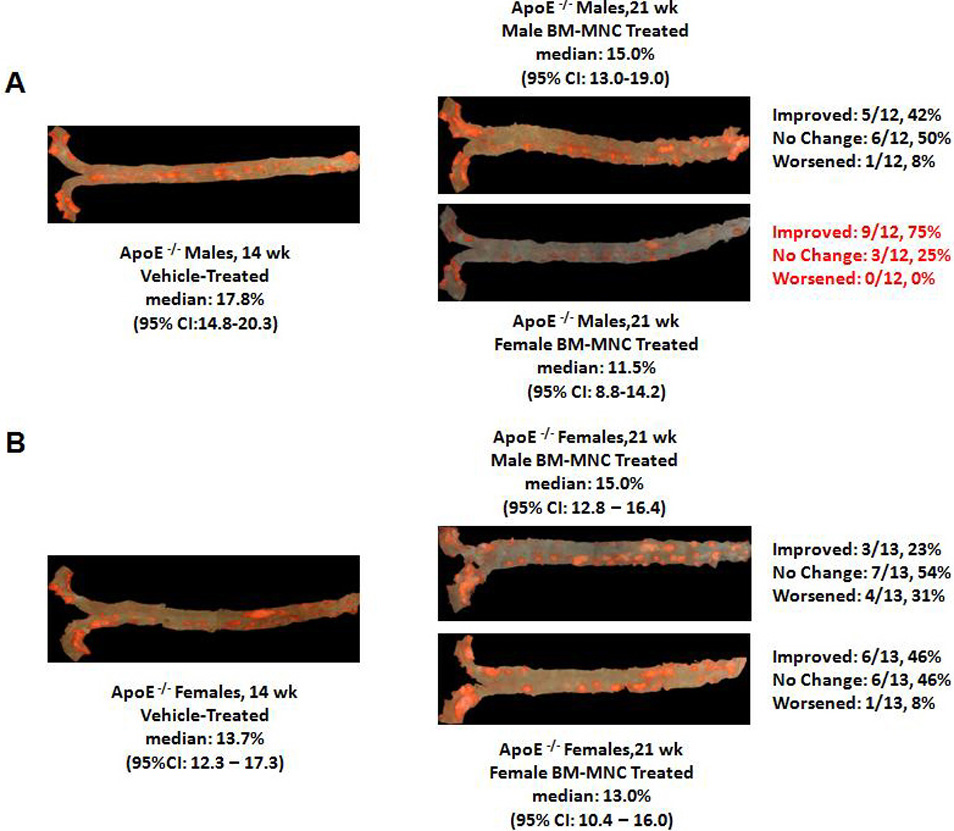
Representative en face aortic preparations stained with Oil red O to visualize lipid deposition and plaque burden. Panel A: males treated with vehicle (left) or with male (upper right) or female (lower right) bone marrow mononuclear cells. Panel B: females treated with vehicle (left) or with male (upper right) or female (lower left) bone marrow mononuclear cells. Exact counts (and proportions, %) of animals per group that improved, did not change, or worsened after cell therapy, are shown to the right of the corresponding en face aortic preparations. Abbreviation: CI, confidence interval.