Figure 5.
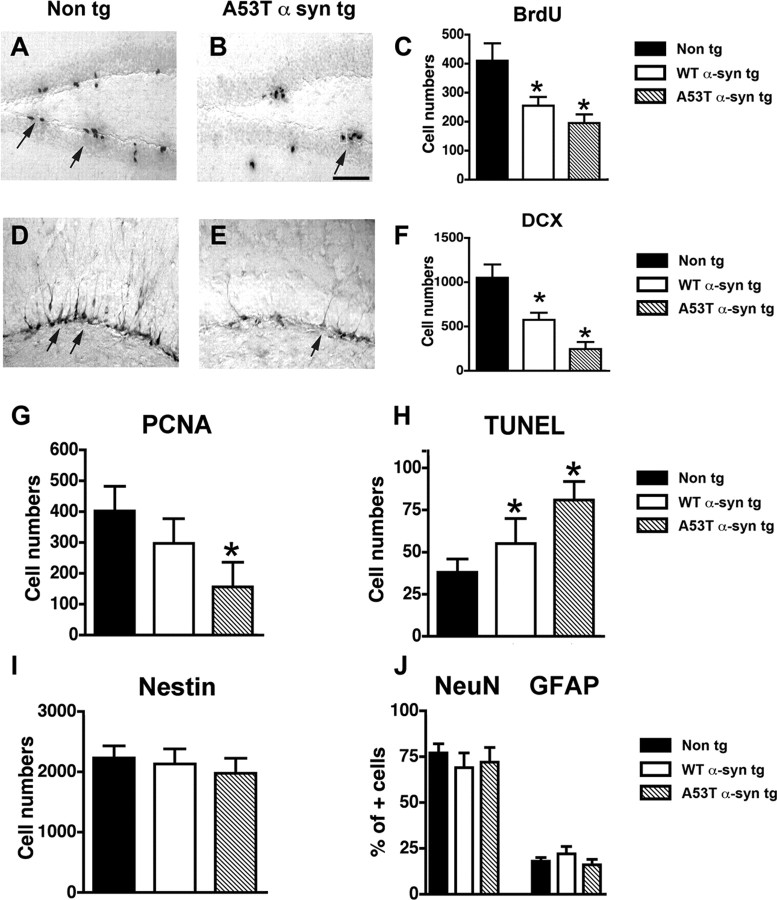
Alterations in neurogenesis in α-syn tg mice. Images are from the SGZ of the DG of 5-month-old mice (n = 5). A, BrdU-positive cells (arrows) in a non-tg mouse 30 d after BrdU treatment. B, Reduced numbers of surviving BrdU-positive cells (arrow) in A53T mut α-syn tg mouse 30 d after BrdU treatment. C, Analysis of total numbers of BrdU-positive cells in the SGZ. D, DCX-positive newly formed neuroblasts (arrows) in a non-tg mouse. E, Reduced numbers of DCX-positive newly formed neuroblasts (arrow) in A53T mut α-syn tg mouse. Scale bar, 50 μm. F, Analysis of total numbers of DCX-positive cells in the SGZ. G, Comparison of numbers of PCNA-positive cells in the DG. H, Comparison of total numbers of TUNEL-positive cells in the DG. I, Comparison of numbers of nestin-positive cells in the DG. J, Comparison of numbers of BrdU-positive cells colabeled with NeuN or GFAP in the DG. *p < 0.05 compared with non-tg control (one-way ANOVA with post hoc Dunnett's test).

