Figure 4.
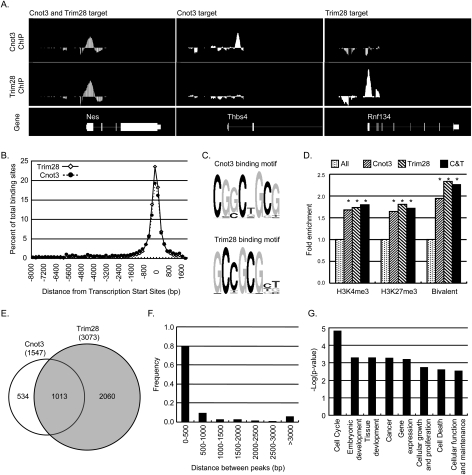
Identification of Cnot3 and Trim28 target genes. (A) Chromosome view of examples of Cnot3 and Trim28 target genes. (B) Distribution of Cnot3- and Trim28-binding sites from target gene TSSs. (C) Consensus binding motif of Cnot3 and Trim28. (D) H3K4 and H3K27 methylation in promoters of Cnot3 and Trim28 target genes. (Fold enrichment) Percentage of H3 methylation in Cnot3 or Trim28/percentage of H3 methylation in the genome. (Asterisks) P < 10−8, calculated by hypergeometric distribution. (E) Venn diagram of target genes co-occupied by Cnot3 and Trim28. (F) Histogram of distance between Cnot3- and Trim28-binding sites in genes occupied by both. (G) GO analysis (by Ingenuity Pathway Analysis) of Cnot3 and Trim28 target genes. Only selected functional categories were shown. For a complete list, see Supplemental Table S3.

