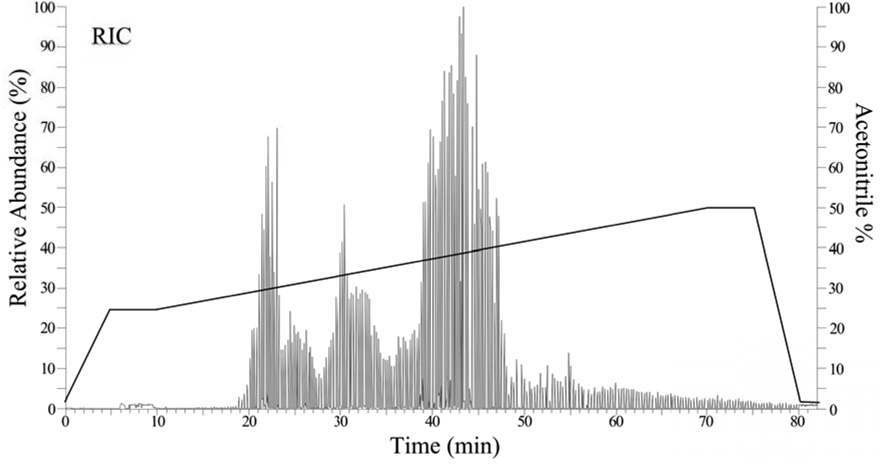
Fig. 2.
Representative automated collision-induced dissociation plot (Auto-CID) of reconstructed ion current versus time (min) from the 2D capillary HPLC-MS/MS analysis of whole cell digest. 2.0 µl of sample was loaded onto the biphasic column.1,2 Peptides were fractionated from the SCX packing onto C18. This plot was from fraction one out of seven. The solid line shows that portion of the acetonitrile gradient during which mass spectra are acquired, the percentage of acetonitrile scales with the relative intensity shown on the y-axis. Each dip in the trace indicates the instrument is switching from main beam (MS1 mode) to CID (MS2 mode).

