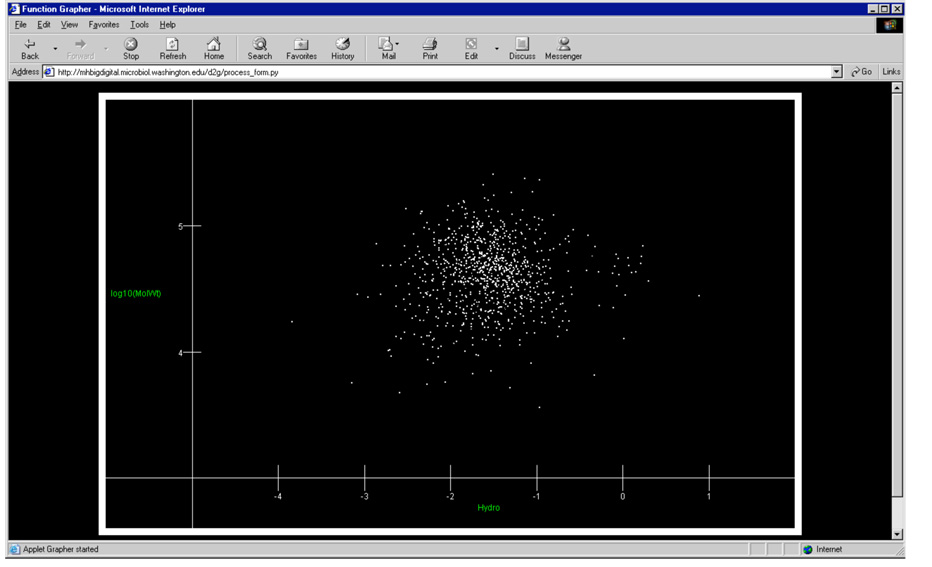
Fig. 4.
A hydrophobicity plot of the same reconstructed protein array as shown in Fig. 3. The hydropobicity calculation was based on the scale published by Engelman, Steitz and Goldman22 and only takes into account primary structure, that is the relative hydrophobicity of the amino acid monomers averaged over the entire ORF. In the plot above the x-axis is hydrophobicity (calculated) and the y-axis is log Mr. More hydrophobic proteins have positive values that graph to the right side of the image.

