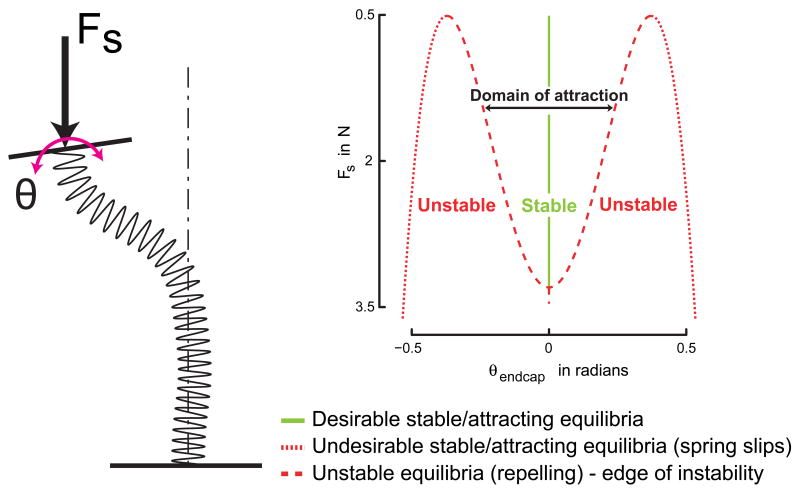
Figure 2.
Subcritical pitchfork bifurcation diagram. This bifurcation diagram on the right shows the loci of both stable (solid line) and unstable/undesirable (dashed/dotted curves) equilibria for the thumb+spring+nervous system's closed loop dynamics without noise or time-delays as the spring is compressed, which is a succinct description of the underlying deterministic (no time-delays / noise) dynamics of our model. The region bounded by the dashed curves around θ = 0 (the endcap orientation we want to stabilize), in which the endcap is attracted towards θ = 0 is the domain of attraction at any particular value of Fs. If the endcap strays too far outside this region, then it will be rapidly attracted towards the points far out (dotted curves, close to 0.5rad), which is representative of a spring slip. The schematic of a buckled spring on the left clarifies the physical meaning of the variables Fs and θ.

