Figure 6.
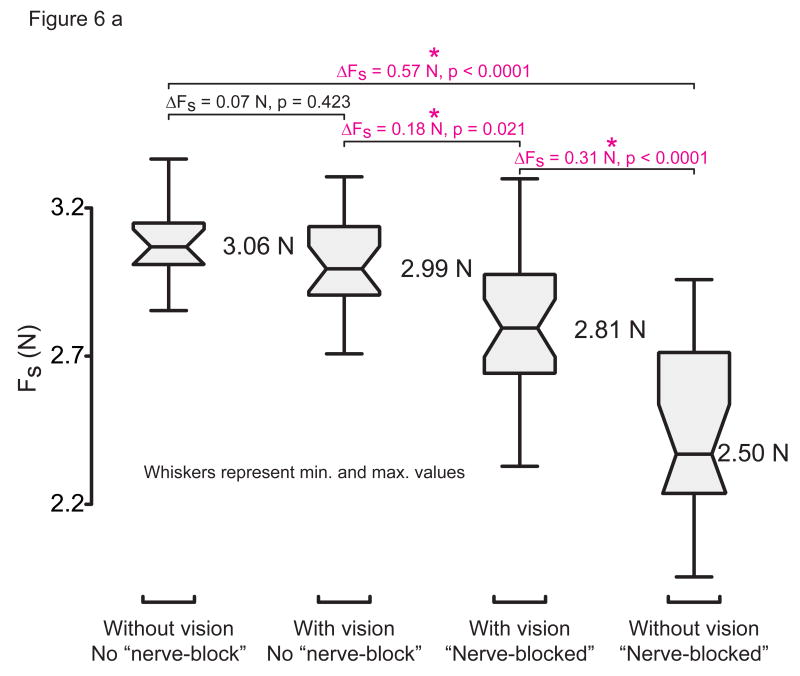
Figure 6a: Box plots of experimental results of sensory occlusion. The horizontal bars inside the box plots is the median, the notches are the robust 95% confidence interval of the median, the boxes are bounded by the 75th percentile and 25th percentile, the numeric values next to each box is the sample mean, and the whiskers represent the entire range of the data. The expected contextual use of vision is found by comparing columns 1 vs. 2 and columns 3 vs. 4. The differences in Fs marked with a ‘*’ symbol are the only significant ones at the preset significance level of 0.025.
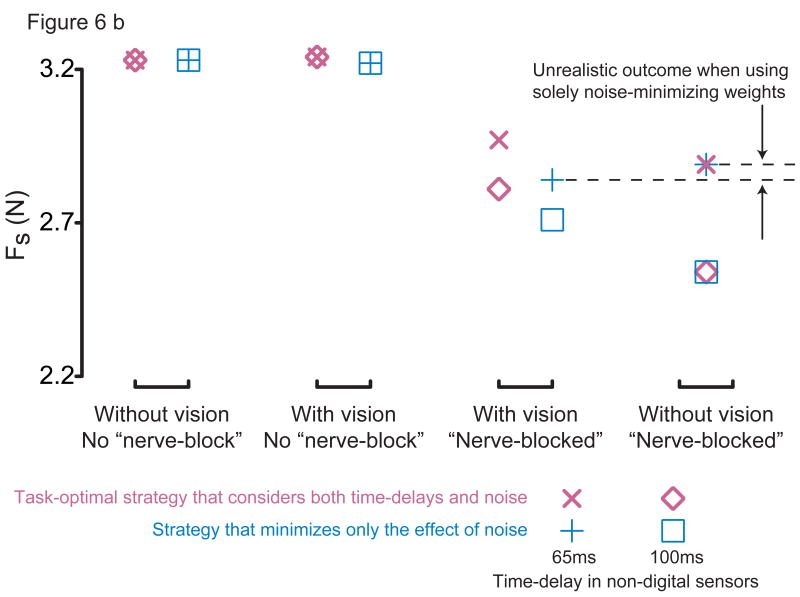
Figure 6b: Results of simulations using two alternate sensory weighting strategies. Only simulations with 65ms time-delay for non-digital sensors (‘×’, ‘+’) and with 100ms time-delay for non-digital sensors that best replicated experimental data (‘◊’, ‘□’) are shown above. The task-optimal strategy (‘×’, ‘◊’) yields better performance (larger Fs) than the noise-minimizing strategy (‘+’, ‘□’) demonstrating the effect of time-delays on multisensory integration. The 100ms-simulation (‘◊’, ‘□’) using a task-optimal strategy (‘×’, ‘◊’) best agreed with experimental data (cf. 3rd vs. 4th columns). Noise-minimizing sensory weights (‘+’, ‘□’), however, yield unrealistic and non-robust results such as an increase in performance after visual occlusion over and above loss of thumbpad sensation (again, cf. 3rd vs. 4th columns). Note that when both thumbpad sensation and vision are absent there is no multisensory integration required since only the non-digital mechanoreceptors remain intact. The sensory weights used in the simulations are listed in Table 1.


