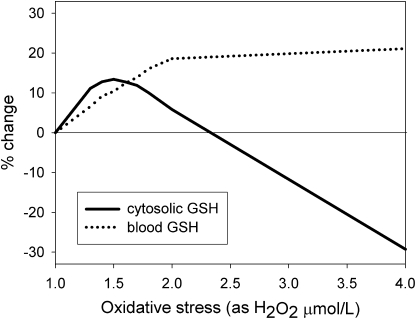
FIGURE 2 .
Effect of different degrees of oxidative stress (expressed as H2O2 in μmol/L) on cytoplasmic and blood total GSH concentrations, expressed as percent change from “normal” [here and elsewhere in this article, “normal” refers to the steady-state metabolite concentrations and reaction velocities generated by the mathematical model described in (24)].

