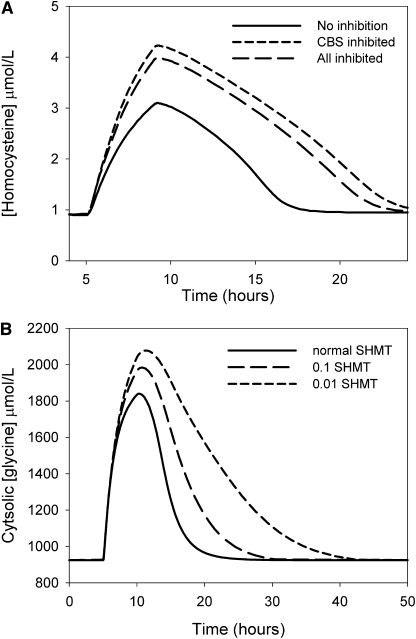
FIGURE 3 .
(A) Effect of methionine loading on the Hcy concentration profile under normal conditions and when the Vmax of all PLP-dependent enzymes was reduced to 50% to simulate a vitamin B-6 deficiency. (B) Effect of variation of the Vmax of cSHMT on the time required for recovery from a glycine input pulse. Extracellular glycine was elevated for 5 h starting at 5 h and then returned to normal. At lower Vmax, the intracellular glycine concentration rose higher and took longer to return to steady state, but the steady-state level was not altered.

