
FIG. 4.
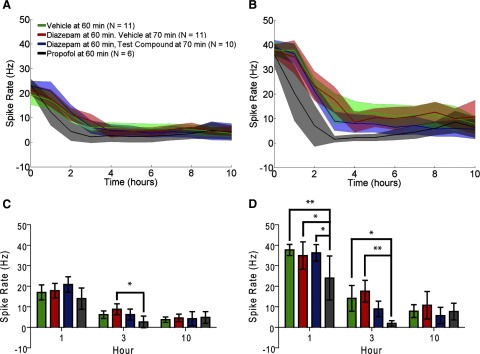
Spike rate evaluation. Data are the mean and 95% CIs of the spike rate calculated in 1-h increments. A: raw EEG. B: EEG data filtered in the γ-band (20–70 Hz). Data groups are the same as in Fig. 3. C: data selection from A at 1, 3, and 10 h. D: data selection from B at 1, 3, and 10 h. *P < 0.05, **P < 0.01. Calculating spike rate from the raw EEG did not describe changes in ESE as well as human evaluation. Filtering the EEG in the γ-band improved the divisibility of the treatment groups, but identified differences in the 1st hour after treatment that were not identified by human evaluation. Filtered EEG spike rate did fail to detect a difference between propofol and diazepam plus test compound treatments observed in human evaluation.