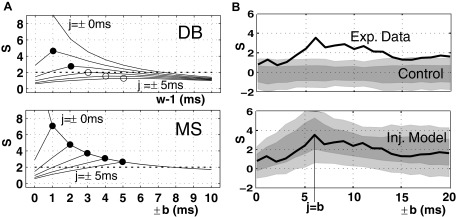
FIG. 2.

Detection of temporally jittered coincidences. A: comparison of the disjunct binning method (DB, top) and the multiple shift method (MS, bottom) using analytical descriptions. The parallel spike trains are assumed as stationary Poisson processes (λ1 = λ2 = 30 Hz) with inserted coincident events (λc = 1 Hz) of a given temporal jitter (j = ±0 … ±5 ms, different curves). The graphs show the surprise for increasing analysis widths (top: for bin sizes w ranging from 1 to 11 ms; bottom: for maximal shifts from b = ±0 … ±10 ms; both in steps of h = 1 ms). For better visualization, the horizontal axes are aligned to correspond to the same maximal spike distances (b = w − 1). Each of the surprise curves shows a distinct peak, marked by filled circles if the values are above the significance level of α = 1%, i.e., S = 2, and marked by an empty circle if below. The values of S for b = w − 1 = 0 (not shown) are 16.76 (DB) and 16.73 (MS). B: temporal precision of neuronal spike trains and its comparison with simulated processes using MS. The black curve (same in both panels) represents the surprise value of the experimental data for increasing analysis shift b. The curve matches closely the curves predicted by the model (A, bottom) and expresses a distinct peak at b = 6 ms. Top: experimental result compared with control data without injected coincidences; firing rates correspond to the measured firing rates (λ1 = 32.1 Hz, λ2 = 35.9 Hz, same duration T = 800 ms and number of trials M = 33). Bottom: experimental result compared with the injection model with jittered coincidences (s = 6 ms) injected. The coincidence rate and the independent background firing rate are estimated from the experimental data (λ1 = 29.1 Hz; λ2 = 32.9 Hz, λc = 3.29 Hz). Results from simulations are shown as gray bands (light gray: 95% of repetitions, dark gray: 70%). (Modified from Grün et al. 1999.)
