FIG. 1.
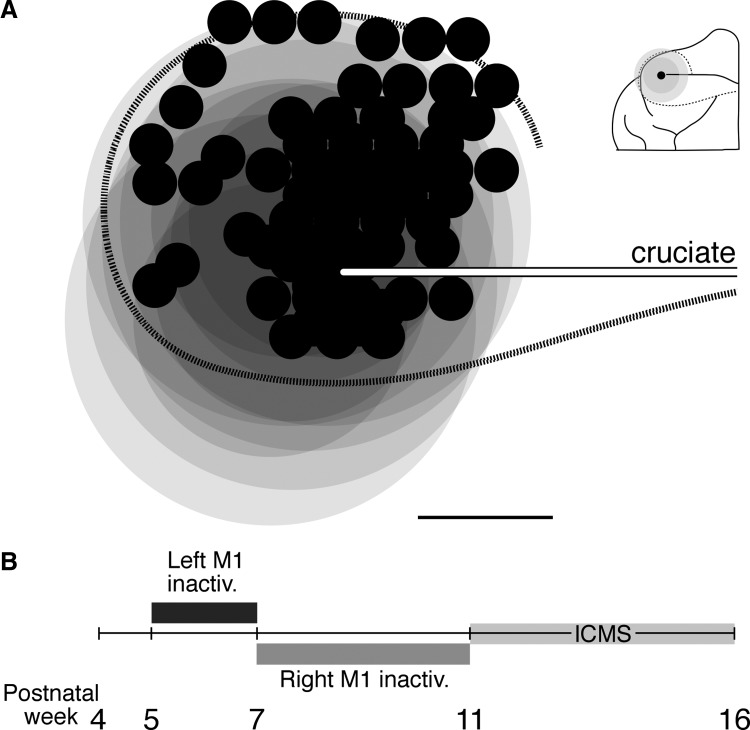
Stimulation sites were within the inactivated region and experimental timeline. A: all stimulation sites (small black circles) in all animals are shown, aligned according to the lateral tip of the cruciate sulcus (white line with black border). Darker gray circles correspond to the region of maximal activity reduction (3-mm radius) for each infusion and the lighter gray circles indicate region of reduced activity reduction for each infusion, based on cytochrome oxidase staining (Martin et al. 1999) and supplemented with parvalbumin immunohistochemistry (Friel et al. 2007). The dotted black line corresponds approximately to the area 4γ border. Inset shows a schematic representation of an example infusion site at the lateral tip of the cruciate sulcus and associated regions of maximal (dark gray) and reduced (light gray) inactivation. Cal. 3 mm. B: timeline showing the ages at which left primary motor cortex (M1) and right M1 inactivations took place.

