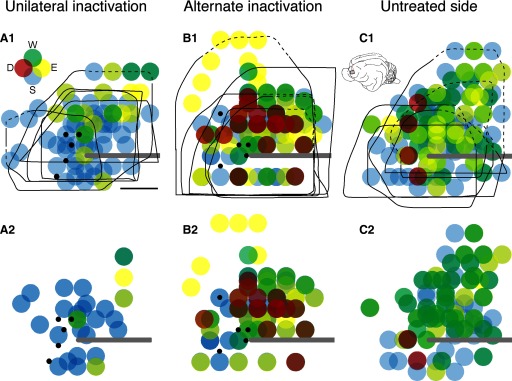
FIG. 3.

Changes in M1 motor representation after unilateral and alternate inactivation. Each colored circle plots the joint effect obtained by stimulation. Data from all experiments are superimposed, with effects obtained at <100 μA shown in the top row and <60 μA, in the bottom row. The black lines in the top row mark the boundaries of the forelimb representation. The dashed portion of the lines correspond to the bony limit of the craniotomy, which was at or very close to the area 4γ border in that experiment. The inset in A1 shows the color coding used (D, digits; W, wrist; E, elbow; S, shoulder) and, in C1, the cat brain and the region explored. Each dot was plotted as 50% transparent, with distal shown as the most superficial graphical layer and proximal, the deepest. A: unilateral inactivated (left) M1. B: alternate inactivation (i.e., the left side, which received the initial inactivation between weeks 5–7, but examined after inactivation of the other M1 from weeks 7–11). C: untreated M1 (i.e., right; contralateral to the M1 that received unilateral inactivation only). Small black dots indicate the infusion sites. Calibration: 2 mm.
