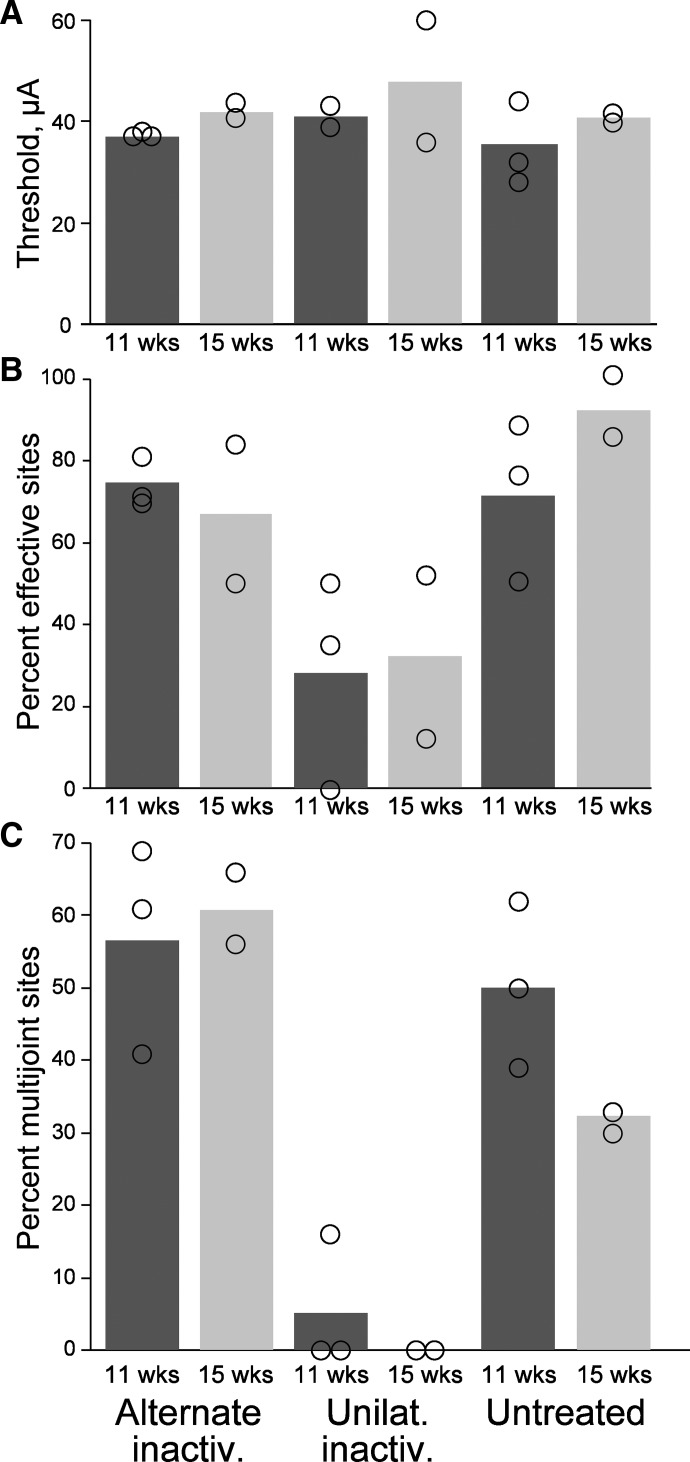
FIG. 6.
The M1 motor representations at weeks 11 through 13 and 14 through 16 are not different. Bars plot mean values. Open circles plot data values from individual animals comprising the 2 ages for each group. Column labeled “11 wks” plots data for animals between weeks 11 and 13. Column labeled “15 wks” plots data for animals between weeks 14 and 16.

