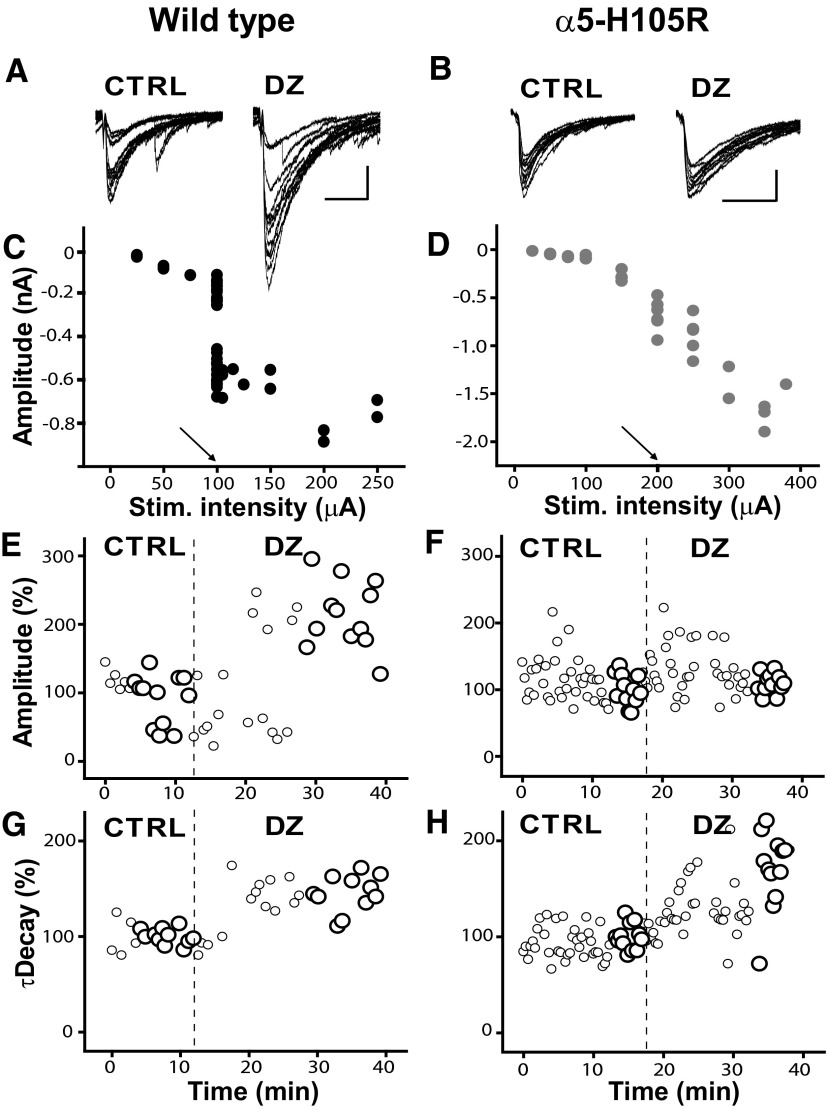
FIG. 5.
Effect of diazepam on GABAA,slow evoked IPSCs (eIPSCs). A and B: responses evoked under control conditions (CTRL) and in the presence of diazepam (DZ, 1 μM), in cells from WT and α5-H105R mice. Scale bars: 50 ms, 200 pA. C and D: response amplitude as a function of stimulus intensity for cells presented in A and B. Arrows indicate the stimulus intensity used to assess effects of DZ. Note that for the WT cell, a 100-μA stimulus evoked 2 populations of slow IPSCs with mean amplitudes of approximately −250 and −500 pA. E and F: time series plots of amplitudes of slow eIPSCs, normalized to the mean of the final 12 eIPSCs under control conditions, from the cells illustrated in A and B. Each circle represents a single evoked response. The large circles designate the responses under steady-state conditions that were averaged and used for further analysis. Note that for WT mice, amplitudes showed a bimodal distribution. The mean amplitudes of slow eIPSCs under control conditions were −439 and −534 pA for WT and α5-H105R mice, respectively. G and H: time series plots of τdecay, normalized to the mean of the final 12 eIPSCs under control conditions, from the cells illustrated in A and B. The mean values of τdecay of slow eIPSCs in CTRL were 38 and 42 ms for WT and α5-H105R mice, respectively.

