
FIG. 4.
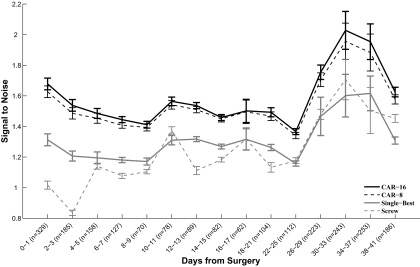
Signal to noise across days. Bars denote SE of the data set on a given block of days. Number of units recorded on a given block of days, n, is listed on the x-axis. Over the course of the study, sites referenced to CAR exhibited a signal-to-noise ratio of 1.59, a significant improvement over referencing to either the single-best microelectrode site (1.31, P < 10−10) or ground screw (1.24, P < 10−10). Variability in signal-to-noise ratio across all types of reference increased toward the end of the study, concurrent with an increase in number of units recorded across all arrays. An increase in number of units recorded starting at 3 wk after implantation has been noted in prior studies (Ludwig et al. 2006; Santhanam et al. 2007; Schwartz 2004).