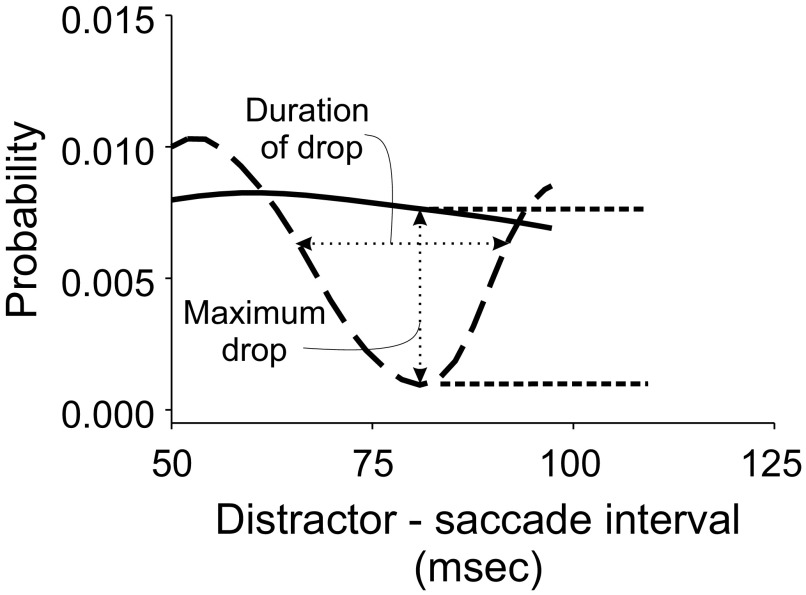
FIG. 2.
Schematic of analyses of saccadic inhibition effect. For each subject's data for a particular target/distractor separation, a density function estimating saccade probability was calculated. This curve was then compared with an analogous one calculated for trials in which the distractor was invisible. We estimated the maximum decrease in saccade probability over time for each set of distractor trials relative to the Invisible Distractor trials, as well as the duration of this reduction in probability. We also calculated the time of peak saccade occurrence. For more details see text.

