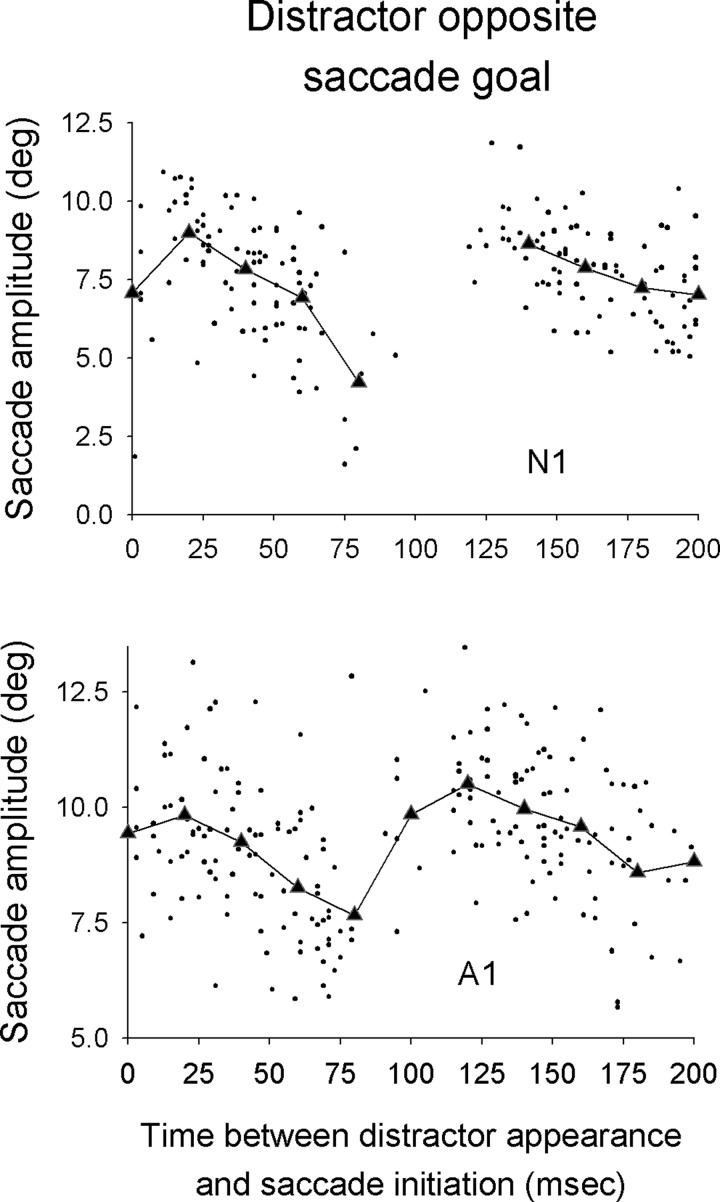
FIG. 5.
Plot of saccade amplitude as a function of the time between distractor appearance and saccade initiation for 2 subjects for experiment 1. Data are from trials in which the distractor appeared opposite the saccade goal. Each dot corresponds to data for one saccade. The lines denote binned averages where the bins were of 20-ms width. Binned averages are shown only if there were ≥6 saccades in the bin.

