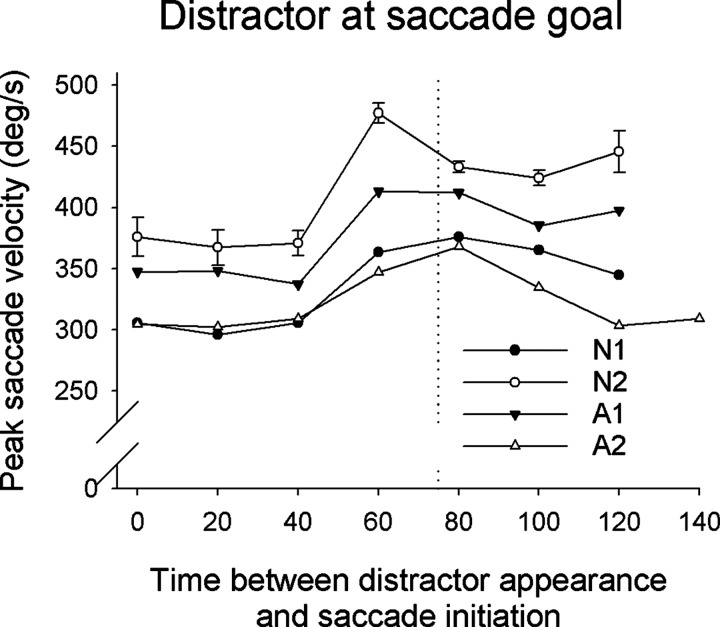
FIG. 7.
Plot of mean peak saccade velocity as a function of time of saccade initiation relative to the appearance of distractor for experiment 1 for trials in which the distractor appeared at the saccade goal (0° saccade goal/distractor separation). The symbols and lines represent 20-ms-width binned averages. Data for a particular bin are shown only if there were ≥6 saccades in the bin.

