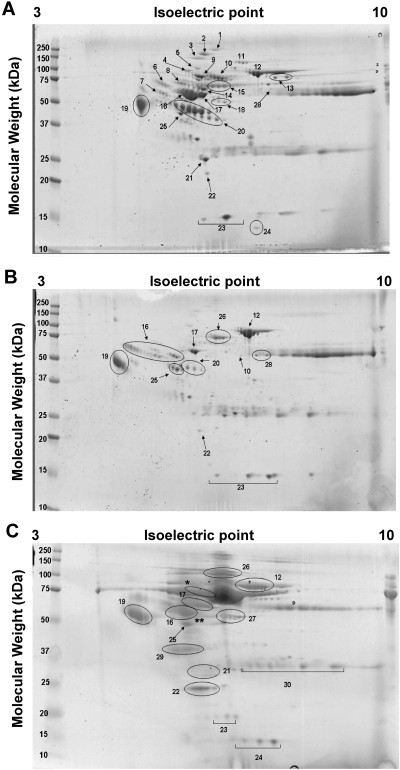
Figure 1.
Representative 2-DE maps from urine samples harvested from children with HIVAN and HIV-HUS. Panel A shows the results from a urine sample collected from a child with biopsy proven HIVAN during the first visit to the hospital (SCr 2.7 mg/dl). Panel B shows the results from a urine sample collected from the same child 1 yr later, while receiving HAART (SCr 1.7 mg/dl). Panel C shows the results from a urine sample collected from a child with HIV-HUS. Albumin-depleted urinary samples were used for 2-DE analysis. Gels were stained with Bio-Safe Coomassie Blue and proteins were processed and analyzed as described in the Materials and Methods section. Numbers labeling spots in panels A–C correspond to protein identifications in Table 1.

