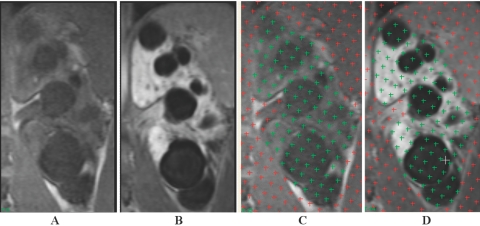
Figure 1.
Coronal T1-weighted magnetic resonance imaging (MRI) from a patient with ADPKD: (A and C) pregadolinium and (B and D) postgadolinium enhancement. Figure C corresponds to Figure A with superimposed stereology grids that were highlighted over the kidney regions by a reader, while Figure D corresponds to Figure B with superimposed stereology grids that were highlighted over the kidney regions by the same reader. With the administration of gadolinium, the kidney parenchyma in (B and D) enhanced brightly while the cysts remained unchanged. Note that the boundary of the kidney in the postgadolinium image (B) is better defined than that in the pregadolinium image (A), particularly near the spine and psoas muscle.

