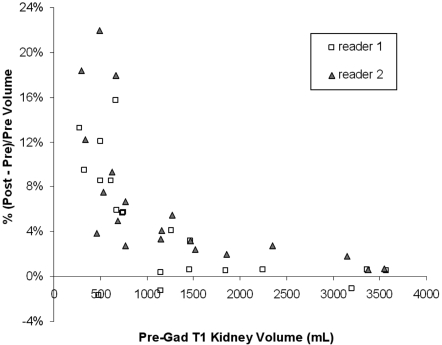
Figure 3.
Plot of the percent volume difference [i.e., (post − pre)/pre x 100] against the pregadolinium T1 kidney volume. The data points represent the total kidney volumes. The postgadolinium T1 kidney volume measurements tended to be larger than the pregadolinium measurements, and the percent volume differences tended to be smaller with increases in the kidney volume.

