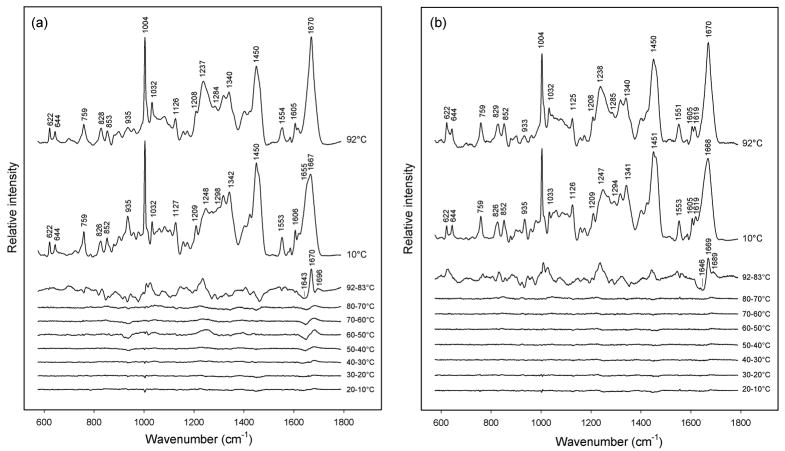
Figure 4.
(a) Temperature-dependence of the Raman spectrum of prohead I. The spectra obtained at 10 and 92 °C and the difference spectra computed for the indicated intervals between 10 and 92 °C are shown, as labeled. The largest spectral change, which corresponds to prohead I disassembly, occurs above 83 °C. The other major spectral transition, which occurs primarily between 50 and 60 °C, corresponds to Δ-domain unfolding within the prohead I assembly. Raman intensities were normalized to the integrated intensity of the amide I band. (The intensity of the tyrosine marker at 644 cm−1 is also invariant to temperature.) (b) Temperature-dependence of the Raman spectrum of prohead II, showing a single transition above 83 °C, which corresponds to prohead II disassembly.

