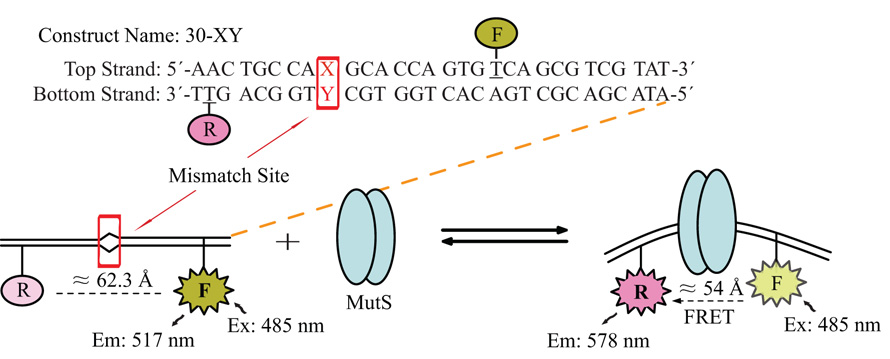
Figure 1. Construct Sequence and Experimental Scheme.
Shown here is the basic sequence of the 30-bp construct, kept identical throughout this study. The box denotes the position of the mismatch site X-Y, which can be configured to produce any mismatch combination. The top strand was labeled with fluorescein, the donor, while the bottom strand was labeled with TAMRA, the acceptor, at the underlined positions. The schematic representation shows that the distance between the donor and acceptor shortened upon MutS binding, giving rise to FRET signals.

