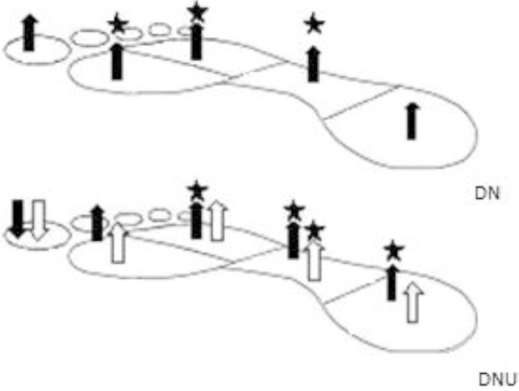
Figure 2 -.
Summary of differences in pressure-time integral according to its tendency. Upper panel presentation: comparison between DN and CG (black arrows), showing higher values for DN. Lower panel: comparison between DNU and CG (black arrows) and to DN (white arrows). Black stars represent significant differences (p<0.05) between groups.

