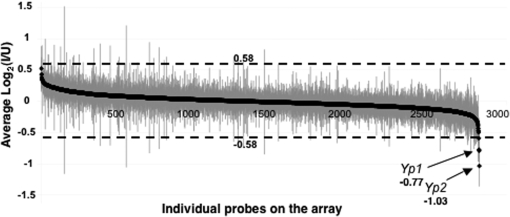
Figure 1.—
Array expression intensity for infected (I) vs. uninfected (U) wild-type previtellogenic ovaries. The average log2 ratio (I/U) for each probe is plotted with solid diamonds in descending order of magnitude, with shaded vertical lines indicating standard errors (values listed in supplemental Table 2S). On the ordinate, 0.58 and −0.58 correspond to a 1.5-fold difference in log2 ratio.

