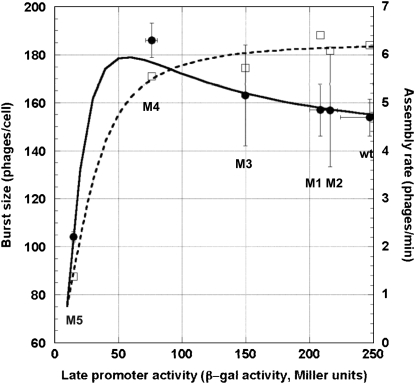
Figure 3.—
Effects of the late promoter activity on assembly rate and burst size. Open squares denote the estimated assembly rates and solid circles show the empirically determined burst sizes. Error bars denote the 95% confidence intervals. The dashed curve shows the fitted model of m =  , where m is the assembly rate and a is the late promoter activity. The solid line shows the predicted burst size based on the equation of b = m(tL − e), where b is the burst size, tL is the lysis time (see Figure 3), m is the assembly rate (see above), and e is the eclipse period of 28 min (see text).

