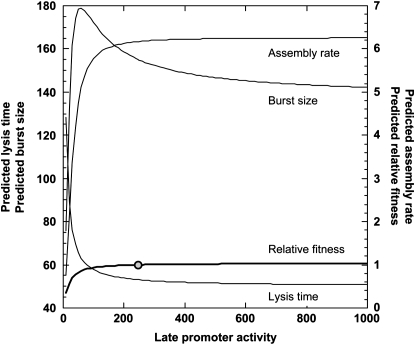
Figure 5.—
The extrapolated relationships between the late promoter activity and assembly rate, lysis time, burst size, and relative fitness. Equations in Figures 2–4 were used to show these relationships when the late promoter activity is higher than that of the wt. The wt promoter activity is shown as a solid circle.

