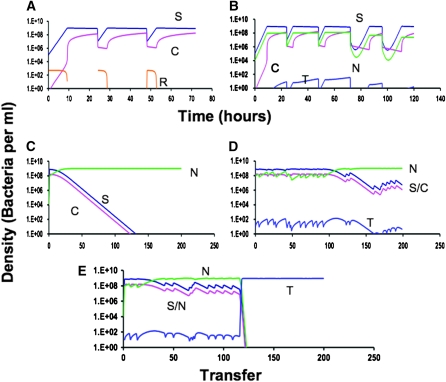
Figure 1.—
Simulation results depicting the population dynamics of competence formation and transformation in serial transfer culture. Changes in the densities of the component populations are as follows: dark blue, S (com+); pink, C (competent cells produced by com+); green, N (com−); blue, T (transformants); orange, resource concentration, R. Parameter values are Ra = 500, d = 0.01, da = 0.50, VS = VN = 1.0, VT = 1.0, VC = 0.001, US = UT = UN = −2.0, UC = −0.01, MIC = 1 for all, f = 0.01, g = 0.10, km = kr = 0.25, and x = 10−16. (A) The dynamics of competence formation: changes in the densities of S, C, and the concentration of the resource R. (B) Competence formation and the fitness of the competent population in a mixed culture with a population, N, that does not produce competent cells. The changes in densities of S, C, and N are displayed before and after two sequential episodes of antibiotic pulses of 10 μg/ml at the starts of the 72- and 96-hr transfers. (C) Long-term dynamics of the S, C, N, and T populations in the absence of antibiotic pulses. (D) Long-term dynamics of the S, C, N, and T populations with antibiotic pulses, p = 0.1 (on average once every 10 transfers with 10 μg/ml added). (E) Long-term dynamics of the S, C, N, and T populations with antibiotic pulses, p = 0.1 with 10 μg/ml added, and episodic selection for transformants, et = 0.0005 (on average once every 2000 hr) with an 80% fitness advantage for transformants. The densities plotted are those at the end of each transfer [that immediately before the fraction, d (0.01) of the population is transferred to fresh medium].

