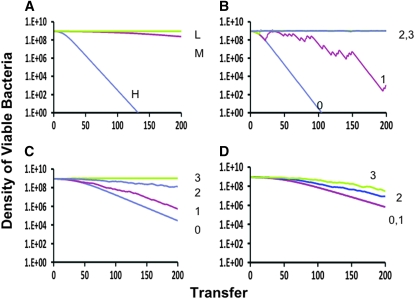
Figure 2.—
Change in the density of competent cells (S + C) with different levels of competence and antibiotic exposure episodes and different levels of competence formation. H, g = 0.01, f = 0.10 (∼0.17 competent cells); M, g = 0.001, f = 0.10 (∼0.02 competent cells); L, g = 0.0001, f = 0.01 (∼0.002 competent cells). To simplify, we have not included the N population. When the S + C populations are declining the N population is increasing and the inverse. (A) No fitness cost other than that associated with production of competent cells. (B–D) The competent population S has an additional 1% (0.01) fitness disadvantage relative to the noncompetent, N, population. (B) Antibiotic treatment regimes: 0, no antibiotics; 1, Ad = 10 μg/ml, p = 0.10 (on average every 10th transfer); 2, Ad = 20 μg/ml, p = 0.10 (on average every 10th transfer); 3, Ad = 10 μg/ml, p = 0.20 (on average every 5 transfers). (B) High-level competence, H; (C) medium level of competence, M; (D) low-level competence, L. Other parameters are the same as in Figure 1. The densities plotted are those at the end of each transfer [that immediately before the fraction, d (0.01) of the population is transferred to fresh medium].

