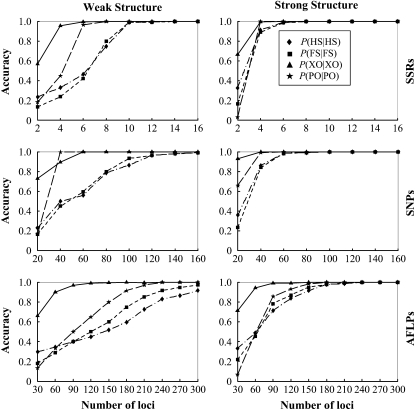
Figure 1.—
Accuracy of parentage and sibship inferences for different types and numbers of markers. The left and right columns correspond to weak and strong family structures, and the top, middle, and bottom rows correspond to SSRs, SNPs, and AFLPs, respectively. Accuracy is measured by the frequencies that simulated full-sib (FS), half-sib (HS), and unrelated (UR) offspring are identified as such, P(FS | FS), P(HS | HS), and P(UR | UR). It is also measured by the frequencies that parentage is correctly assigned, P(PO | PO), and correctly unassigned, P(XO | XO), for the offspring whose actual parents are included in and excluded from the candidates, respectively. The values of P(UR | UR) are always close to 1 for different types and numbers of markers and are thus not shown. Weak and strong family structures refer to small and large sibship sizes, respectively, and the frequencies of all 10 codominant alleles at a locus are assumed to be equal.

